Perform sentiment analysis on financial news in seconds!
Keeping up with the news on finance and particular stocks can be extremely beneficial to your trading strategy as it often dictates what will happen to prices. Therefore, I created this algorithm that easily and quickly parses the FinViz stock screener and calculates the sentiment of the news headlines for any inputted ticker.

FinViz[5] is undoubtedly one of the most powerful stock screeners on the web. It gives free access to an incredible amount of information including interactive charts, over 70 fundamental ratios, large bank trading data, and updated news headlines for virtually any stock. If you have never used FinViz before, I’ve included a screenshot below of the data it has for Apple Inc. and what we will be scraping in this post.

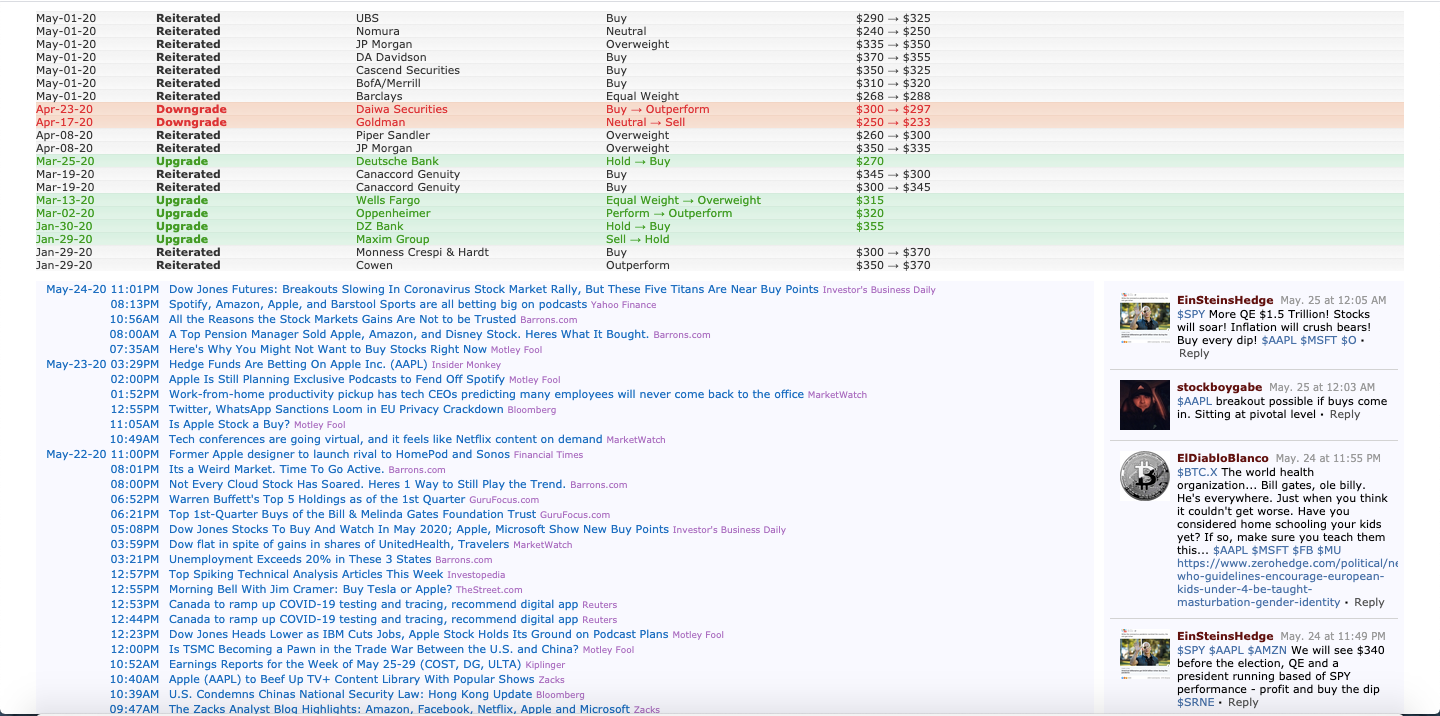
The information in blue for the second screenshot is the updated news headlines and those are exactly what we will be scraping and performing sentiment analysis on. Now that we have gone over the data we will be using, let's get into the code!
To get started, first import the following modules and set the parameters to your preference. The variable n represents the number of articles that will be displayed for each ticker in the ‘tickers’ list. The rest of the code will not have to be manually updated and these are the only parameters you will have to change each time you run the code.
Next, we will get the news data from the FinViz website using the modules BeautifulSoup and requests. The code parses the URL for the HTML table of news and iterates through the list of tickers to gather the recent headlines for each ticker. For each inputted stock, an ‘n’ number of recent headlines is printed out so the data is easy to view.
In order to perform the sentiment analysis, the data must be in the proper format and so this piece of code iterates through the collected news and sorts it into a list of tickers, dates, times, and the actual headline.
Using the powerful nltk module, each headline is analyzed for its polarity score on a scale of -1 to 1, with -1 being highly negative and highly 1 being positive.
Finally, the data is ready to be manipulated and viewed in an appealing manner. For each ticker in the inputted list, a new DataFrame will be created that includes its headlines and their respective scores. Lastly, a final DataFrame will be created that includes each ticker’s mean sentiment value over all the recent news parsed.
The GitHub gist above contains all the code for this post. I hope this algorithm will prove useful to you in the future. Thank you so much for reading!
Disclaimer: The material in this article is purely educational and should not be taken as professional investment advice. Invest at your own discretion.
If you enjoyed this article, join my free investing community on Finary and check out some of my Python for Finance articles below!
Parse Thousands of Stock Recommendations in Minutes with Python!
Learn how to parse thousands of recommendations from top analysts in less than 3 minutes!
towardsdatascience.com
References
- ^ Shashank Vemuri (shashank-vemuri.medium.com)
- ^ May 25, 2020·3 min read (towardsdatascience.com)
- ^ StockSnap (pixabay.com)
- ^ Pixabay (pixabay.com)
- ^ FinViz (finviz.com)
- ^ FinaryFind your investing communityfinary.io (finary.io)
- ^ Parse Thousands of Stock Recommendations in Minutes with Python!Learn how to parse thousands of recommendations from top analysts in less than 3 minutes!towardsdatascience.com (towardsdatascience.com)
- ^ Making a Stock Screener with Python!Learn how to make a powerful stock screener based on Mark Minervini’s Trend Template with Python.towardsdatascience.com (towardsdatascience.com)
- ^ Creating a Finance Web App in 3 Minutes!Learn how to create a Technical Analysis app using Streamlit in Python!towardsdatascience.com (towardsdatascience.com)